The Research Mining Technology

Wednesday 19 December 2012

Artificial Neural Networks

What are Neural Networks?
  •  Models of the brain and nervous system
  • Highly parallel 
               Process information much more like the brain than a serial computer
  • Learning
  • Very simple principles
  • Very complex behaviors
  • Applications
1.      As powerful problem solvers
2.      As biological models
Biological Neural Nets
Pigeons as art experts (Watanabe et al. 1995)
      Experiment:
  • Pigeon in Skinner box
 
  • Present paintings of two different artists (e.g. Chagall / Van Gogh)
 
  • Reward for pecking when presented a particular artist (e.g. Van Gogh)
  • Pigeons were able to discriminate between Van Gogh and Chagall with 95% accuracy (when presented with pictures they had been trained on)
  • Discrimination still 85% successful for previously unseen paintings of the artists
  • Pigeons do not simply memorise the pictures
  • They can extract and recognise patterns (the ‘style’)
  • They generalise from the already seen to make predictions
  • This is what neural networks (biological and artificial) are good at (unlike conventional computer)
 

Share:

Saturday 17 November 2012

R code for Wilcoxon rank sum test


Example 1 (R-Code Script)
     Two samples of Young walleye were drawn from two different lakes and the fish were weighed. The data in g are:
R-Code and Results:
> X.1<-c(253,218,292,280,276,275)
> X.2<-c(216,291,256,270,277,285)
> sample<-c(rep(1,6),rep(2,6))
> w<-data.frame(c(X.1,X.2),sample)
> names(w)[1]<-'weight(g)'
> cbind(w[1:6,],w[7:12,])
  weight(g) sample weight(g) sample
1       253      1       216      2
2       218      1       291      2
3       292      1       256      2
4       280      1       270      2
5       276      1       277      2
6       275      1       285      2
> idx<-sort(w[,1],index.return=TRUE)
> d<-rbind(weight=w[idx$ix,1],sample=w[idx$ix,2],
+ rank=1:12)
> dimnames(d)[[2]]<-rep('',12);d
                                                      
weight 216 218 253 256 270 275 276 277 280 285 291 292
sample   2   1   1   2   2   1   1   2   1   2   2   1
rank     1   2   3   4   5   6   7   8   9  10  11  12
> rank.sum<-c(sum(d[3,d[2,]==1]),
+ sum(d[3,d[2,]==2]))
> rank.sum<-rbind(sample=c(1,2),
+ 'rank sum'=rank.sum)
> dimnames(rank.sum)[[2]]<-c('','');rank.sum
             
sample    1  2
rank sum 39 39
> wilcox.test(X.1,X.2)

        Wilcoxon rank sum test

data:  X.1 and X.2
W = 18, p-value = 1
alternative hypothesis: true location shift is not equal to 0
>
Share:

Wednesday 3 October 2012

Sample applications of outlier detection

Fraud detection
Purchasing behavior of a credit card owner usually changes when the card is stolen.
Abnormal buying patterns can characterize credit card abuse
Medicine
Unusual symptoms or test results may indicate potential health problems of a patient
Whether a particular test result is abnormal may depend on other characteristics of the patients (e.g. gender, age …)
Public health
The occurrence of a particular disease, e.g. tetanus, scattered across various hospitals of a city indicate problems with the corresponding vaccination program in that city.
Whether an occurrence is abnormal depends on different aspects like frequency, spatial correlation, etc.
Sports statistics
In many sports, various parameters are recorded for players in order to evaluate the players’ performances
Outstanding (in a positive as well as a negative sense) players may be identified as having abnormal parameter values
Sometimes, players show abnormal values only on a subset or a special combination of the recorded parameters
Detecting measurement errors
Data derived from sensors (e.g. in a given scientific experiment) may contain measurement errors
Abnormal values could provide an indication of a measurement error
Removing such errors can be important in other data mining and data analysis tasks
“One person‘s noise could be another person‘s signal.”
Share:

Tuesday 2 October 2012

Types of Outliers

An important aspect of an outlier detection technique is the nature of the desired outlier. Outliers can be classified into following three categories:
  • Point Outliers
  • Contextual Outliers
  • Collective Outliers.
Point Outliers:
If an individual data instance can be considered as anomalous with respect to the rest of data, then the instance is termed as a point outlier. This is the simplest type of outlier and is the focus of majority of research on outlier detection. For example, in Figure 1, points o1 and o2 as well as points in region O3 lie outside the boundary of the normal regions, and hence are point outliers since they are different from normal data points. As a real life example, if we consider credit card fraud detection with data set corresponding to an individual's credit card transactions assuming data definition by only one feature: amount spent. A transaction for which the amount spent is very high compared to the normal range of expenditure for that person will be a point outlier.
Contextual Outliers:
If a data instance is anomalous in a specific con-text (but not otherwise), then it is termed as a contextual outlier (also referred to as conditional outlier [1]). The notion of a context is induced by the structure in the data set and has to be specified as a part of the problem formulation. Each data instance is defined using two sets of attributes:
Contextual attributes. The contextual attributes are used to determine the context (or neighborhood) for that instance. For example, in spatial data sets, the longitude and latitude of a location are the contextual attributes. In time series data, time is a contextual attribute which determines the position of an instance on the entire sequence.
Behavioral attributes. The behavioral attributes define the non-contextual characteristics of an instance. For example, in a spatial data set describing the average rainfall of the entire world, the amount of rainfall at any location is a behavioral attribute.
The anomalous behavior is determined using the values for the behavioral attributes within a specific context. A data instance might be a contextual outlier in a given context, but an identical data instance (in terms of behavioral attributes) could be considered normal in a different context. This property is key in identifying contextual and behavioral attributes for a contextual

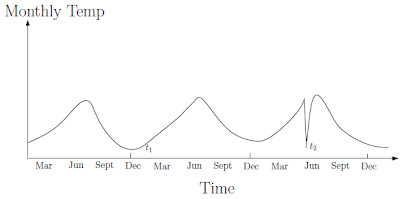
Contextual outlier t2 in a temperature time series. Temperature at time t1 is same as that at time t2 but occurs in a different context and hence is not considered as an outlier.
Contextual outliers have been most commonly explored in time-series data [2] and spatial data [3]. Figure 3 shows one such example for a temperature time series which shows the monthly temperature of an area over last few years. A temperature of 35F might be normal during the winter (at time t1) at that place, but the same value during summer (at time t2) would be an outlier. A six ft tall adult may be a normal person but if viewed in context of age a six feet tall kid will definitely be an outlier.
A similar example can be found in the credit card fraud detection with contextual as time of purchase. Suppose an individual usually has a weekly shopping bill of $100 except during the Christmas week, when it reaches $1000. A new purchase of $1000 in a week in July will be considered a contextual outlier, since it does not conform to the normal behavior of the individual in the context of time (even though the same amount spent during Christmas week will be considered normal).
The choice of applying a contextual outlier detection technique is determined by the meaningfulness of the contextual outliers in the target application domain. Applying a contextual outlier detection technique makes sense if contextual attributes are readily available and therefore defining a context is straightforward. But it becomes difficult to apply such techniques if defining a context is not easy.
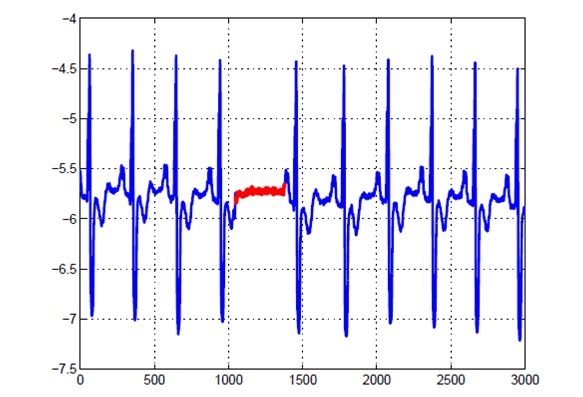
Collective Outliers:
If a collection of related data instances is anomalous with respect to the entire data set, it is termed as a collective outlier. The individual data instances in a collective outlier may not be outliers by themselves, but their occurrence together as a collection is anomalous. Figure 4 illustrates an example which shows a human electrocardiogram output [4]. The highlighted region denotes an outlier because the same low value exists for an abnormally long time (corresponding to an Atrial Premature Contraction). It may be noted that low value by itself is not an outlier but its successive occurrence for long time is an outlier.

Collective outlier in an human ECG output corresponding to an
Atrial Premature Contraction.
As an another illustrative example, consider a sequence of actions occurring in a computer as shown below: ……...http-web, buffer-overflow, http-web, http-web, smtp-mail, ftp, http-web, ssh, smtp-mail, http-web, ssh, buffer-overflow, ftp, http-web, ftp, smtp-mail, httpweb…… The highlighted sequence of events (buffer-overflow, ssh, ftp) correspond to a typical web based attack by a remote machine followed by copying of data from the host computer to remote destination via ftp. It should be noted that this collection of events is an outlier but the individual events are not outliers when they occur in other locations in the sequence.
Collective outliers have been explored for sequence data [5,6], graph data [7], and spatial data [8]. It should be noted that while point outliers can occur in any data set, collective outliers can occur only in data sets in which data instances are related. In contrast, occurrence of contextual outliers depends on the availability of context attributes in the data. A point outlier or a collective outlier can also be a contextual outlier if analyzed with respect to a context. Thus a point outlier detection problem or collective outlier detection problem can be transformed to a contextual outlier detection problem by incorporating the context information.
Reference:
Forrest, S., Warrender, C., and Pearlmutter, B. 1999. Detecting intrusions using system calls: Alternate data models. In Proceedings of the 1999 IEEE ISRSP. IEEE Computer Society, Washington, DC, USA, 133 - 145.
Goldberger, A. L., Amaral, L. A. N., Glass, L., Hausdorff, J. M., Ivanov, P. C., Mark, R. G., Mietus, J. E., Moody, G. B., Peng, C.-K., and Stanley, H. E. 2000. PhysioBank, PhysioToolkit, and PhysioNet: Components of a new research resource for com-plex physiologic signals. Circulation 101, 23, e215 - e220. Circulation Electronic Pages: http://circ.ahajournals.org/cgi/content/full/101/23/e215.
Kou, Y., Lu, C.-T., and Chen, D. 2006. Spatial weighted outlier detection. In Proceedings of SIAM Conference on Data Mining.
Noble, C. C. and Cook, D. J. 2003. Graph-based outlier detection. In Proceedings of the 9th ACM SIGKDD international conference on Knowledge discovery and data mining. ACM Press, 631 - 636.
Sekar, R., Bendre, M., Dhurjati, D., and Bollineni, P. 2001. A fast automaton-based method for detecting anomalous program behaviors. In Proceedings of the IEEE Symposium on Security and Privacy. IEEE Computer Society, 144.
Song, X., Wu, M., Jermaine, C., and Ranka, S. (2007). Conditional outlier detection. IEEE Transactions on Knowledge and Data Engineering 19, 5, 631-645.
Sun, P., Chawla, S., and Arunasalam, B. 2006. Mining for outliers in sequential databases. In SIAM International Conference on Data Mining.
Weigend, A. S., Mangeas, M., and Srivastava, A. N. (1995). Nonlinear gated experts for time-series – discovering regimes and avoiding overfitting. International Journal of Neural Systems 6, 4, 373-399.
Share:

introduction and applications of outliers


Introduction:
        An outlier is an observation (or measurement) that is different with respect to the other values contained in a given dataset. Outliers can be due to several causes. The measurement can be incorrectly observed, recorded or entered into the process computer, the observed datum can come from a different population with respect to the normal situation and thus is correctly measured but represents a rare event. In literature different definitions of outlier exist: the most commonly referred are reported in the following:
Definitions:
An outlier is an observation that deviates so much from other observations as to arouse suspicions that is was generated by a different mechanism “ (Hawkins, 1980).
An outlier is an observation (or subset of observations) which appear to be inconsistent with the remainder of the dataset” (Barnet & Lewis, 1994).
An outlier is an observation that lies outside the overall pattern of a distribution” (Moore and McCabe, 1999).
Outliers are those data records that do not follow any pattern in an application” (Chen and al., 2002).
An outlier in a set of data is an observation or a point that is considerably dissimilar or inconsistent with the remainder of the data” (Ramasmawy at al., 2000).
Many data mining algorithms try to minimize the influence of outliers for instance on a final model to develop, or to eliminate them in the data pre-processing phase. However, a data miner should be careful when automatically detecting and eliminating outliers because, if the data are correct, their elimination can cause the loss of important hidden information (Kantardzic, 2003). Some data mining applications are focused on outlier detection and they are the essential result of a data-analysis (Sane & Ghatol, 2006).
The outlier detection techniques find applications in credit card fraud, network robustness analysis, network intrusion detection, financial applications and marketing (Han & Kamber, 2001).
A more exhaustive list of applications that exploit outlier detection is provided below (Hodge, 2004):
  • Fraud detection: fraudulent applications for credit cards, state benefits or fraudulent usage of credit cards or mobile phones.
  • Loan application processing: fraudulent applications or potentially problematical customers.
  • Intrusion detection, such as unauthorized access in computer networks.
  • Activity monitoring: for instance the detection of mobile phone fraud by monitoring phone activity or suspicious trades in the equity markets.
  • Network performance: monitoring of the performance of computer networks, for example to detect network bottlenecks.
  • Fault diagnosis: processes monitoring to detect faults for instance in motors, generators, and pipelines.
  • Structural defect detection, such as monitoring of manufacturing lines to detect faulty production runs.
  • Satellite image analysis: identification of novel features or misclassified features.
  • Detecting novelties in images (for robot neotaxis or surveillance systems).
  • Motion segmentation: such as detection of the features of moving images independently on the background.
  • Time-series monitoring: monitoring of safety critical applications such as drilling or high-speed milling.
  • Medical condition monitoring (such as heart rate monitors).
  • Pharmaceutical research (identifying novel molecular structures).
  • Detecting novelty in text. To detect the onset of news stories, for topic detection and tracking or for traders to pinpoint equity, commodities.
  • Detecting unexpected entries in databases (in data mining application, to the aim of detecting errors, frauds or valid but unexpected entries).
  • Detecting mislabeled data in a training data set.
How the outlier detection system deals with the outlier depends on the application area. A system should use a classification algorithm that is robust to outliers to model data with naturally occurring outlier points. In any case the system must detect outlier in real time and alert the system administrator. Once the situation has been handled, the anomalous reading may be separately stored for comparison with any new case but would probably not be stored with the main system data as these techniques tend to model normality and use outliers to detect anomalies (Hodge, 2004).
Reference:
  1. Barnet, V. & Lewis, T. (1994), Outliers in statistical data, John Wiley, ISBN 0-471-93094-6, Chichester.
  2. Chen, Z.; Fu, A. & Tang, J., (2002). Detection of outliered Patterns, Dept. of CSE, Chinese University of Hong Kong.
  3. Han, J. & Kamber M. (2001) Data Minings Concepts and Techniques, Morgan Kauffman Publisdhers.
  4. Hawkins, D. (1980), Identification of Outliers, Chapman and Hall, London.
  5. Hodge, V.J. (2004), A survey of outlier detection methodologies, Kluver Academic Publishers, Netherlands, January 2004.
  6. Kantardzic, M. (2003). Data mining Concepts, Models, Methods and Algorithms. IEEE Transactions on neural networks, Vol.14, N. 2, March 2003.
  7. Moore, D.S. & McCabe G.P. (1999), Introduction to the Practice of Statistics. , Freeman &Company.
  8. Ramasmawy R.; Rastogi R. & Kyuseok S. (2000). Efficient algorithms for mining outliers from large data sets. Proceedings of the ACM SIGMOD International Conference on Management of Data, pp.427-438, ISBN 1-58113-217-4, Dallas, Texas, United States.
  9. Sane, S. & Ghatol, A. (2006), Use of Instance Tipicality for Efficient Detection of Outliers with neural network Classifiers. Proceedings of 9thInternational Conference on Information Technology, ISBN 0-7695-2635-7.
Share:

Comment

BTemplates.com

Search This Blog

Powered by Blogger.

Translate

About Me

My photo
Tirunelveli, Tamil Nadu, India

Featured post

Mahalanobis Distance using R code

Mahalanobis distance is one of the standardized distance measure in statistics. It is a unit less distance measure introduced by P. C. Mah...

Weekly